- What We Drive
The Evolution of Business Models in the Energy Market: Recognizing Trends, Understanding Timing, Shaping Transformation
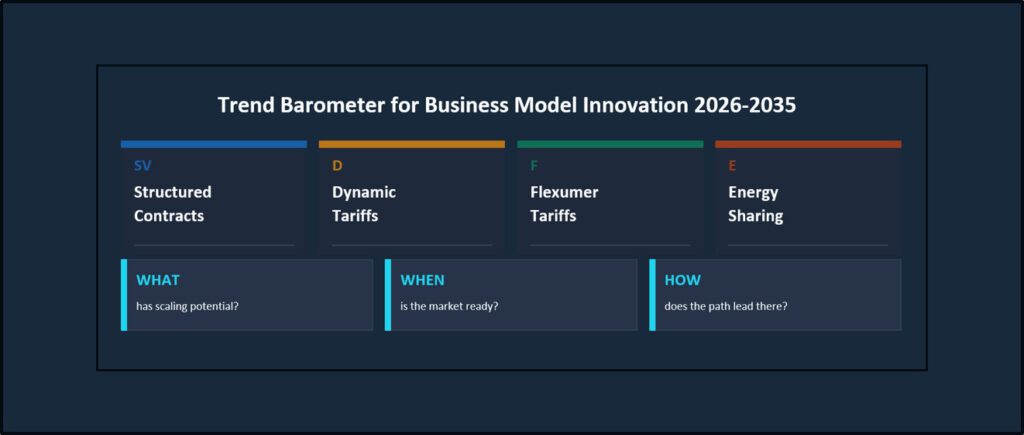
Together with exnaton, we worked on a trend barometer for Germany. We asked ourselves: Where are business models heading? Which models will scale — and when will the market be ready for them?
exnaton brings a particular perspective to this: as a software company that supports the billing of innovative energy products, it sees early on what works in practice and what doesn’t. Whoever handles the billing sees the market — not in theory, but in live tariffs, metering points, and customer behavior.
The commodity volume business continues to shrink
Before we turn to the trend barometer and its product categories, it’s worth looking at the starting point: Why is classic full supply losing substance — and why is this trend structural? A few data points illustrate the trend in Germany.
Despite growing electrification, SLP (standard load profile) electricity sales fell from 150.6 TWh (2023) to 147.6 TWh (2024), a decrease of 3 TWh (BNetzA, Monitoring Report 2025). Over the same period, households’ PV self-consumption grew from 8.2 TWh to 12.3 TWh — an increase of just over 4 TWh (Fraunhofer ISE, Dec. 2025). The math shows: the additional electricity demand created by EVs (9% of households, KfW Energy Transition Barometer 2025) and heat pumps (8% of households) is already being more than offset today, within the SLP segment, by the growth in self-generation. In other words: even growing electrification does not prevent the decline of full supply — it merely shifts volume toward self-consumption.
A driver of this development in the household segment: already one in six households generates its own electricity, and every second PV system is now combined with a battery storage unit — two years ago it was only one in four (KfW Energy Transition Barometer 2025). The trend accelerated further in 2025: PV self-consumption rose to 16.9 TWh (+37%); as a result, households covered around 19 percent of their total PV generation themselves, rather than feeding it into the grid (Fraunhofer ISE, Dec. 2025 & Jan. 2026).
In the B2B segment, the ratio of used to unused potential is particularly uneven. Against the 77 GW of installed rooftop PV on buildings in Germany (BNetzA/MaStR, Feb. 2026) stands roughly 330 GW of untapped potential, of which 36 GW alone is on logistics and industrial roofs (Garbe, 2024; Agora/greenventory, 2023). This becomes vivid when looking at commercial roofs: four out of five warehouse roofs still have no PV installed (Fraunhofer IIS/BVL, 2025).
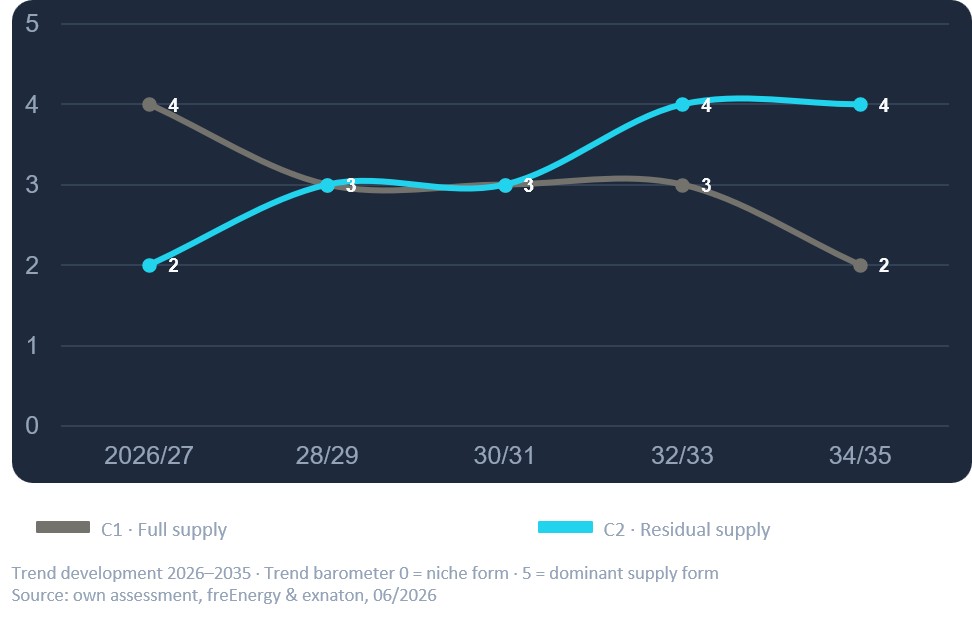
In our assessment, full supply (C1) will continue to lose market share and slowly and gradually become a niche form. Residual electricity supply (C2) will become the dominant commodity supply form. The curves shown illustrate the expected shift in market share between the two supply forms over the next 10 years.
Three forces are driving this development:
- increasing price volatility in electricity markets,
- regulatory impulses from the new market design, and
- growing customer demand for independence and energy cost optimization.
With the rollout of smart metering systems and the structural establishment of energy communities, the addressable target group is continuously growing. While energy efficiency used to be the only lever for cost reduction, in the future it will be products that reward flexibility that drive demand — at the latest once the knowledge about the savings potential reaches the mainstream.
And this potential is considerable — though its size varies by customer segment. According to the PwC study “The Future of Energy Suppliers” (2025), the lowest total price is the most important criterion for 71% of households — 85% show a fundamental willingness to adapt their consumption behavior for cost savings. Two independent calculations for differently equipped households show how large the lever can be in individual cases: the BCG study “Energy Management Systems” (2025) puts the potential for households with a heat pump, battery storage, and EV at €350 to €450 per year through dynamic tariff optimization alone — with more advanced market integration, this figure could double or triple. exnaton’s simulation calculations (June 2026) cover a broader range of household types: those who only optimize their consumption save around €110 to €510 annually. Those who additionally use time-variable grid fees achieve up to €860. And prosumers who also market their feed-in dynamically can reach up to €1,300 per year.
For a portfolio-specific assessment of the calculated savings potential, exnaton’s experts are available on request.
The potential for end customers is enormous, while the range of offerings is (still) limited. This raises two fundamental questions that energy suppliers’ product management teams should ask themselves:
1. What products do we offer customers without self-generation?
2. How do we secure the residual electricity supply for customers with their own generation, storage, or controllable consumption devices?
To derive a strategy that goes beyond regulatory obligation, it is worth looking back: which business models have scaled in the German energy market so far — and which have not? The answer shows which conditions make scaling possible in the first place.
What history teaches: patterns of scaling in the energy market
Based on our experience of more than 30 years in the energy industry, recurring patterns emerge from market development since liberalization. Four are particularly relevant for classifying new business models:
1. Digital infrastructure is a prerequisite. It determines whether a business model scales broadly.
2. Workarounds have an economic limit. They can serve as a bridge if they remove complexity from the process or if the volume justifies the effort.
3. Regulatory frameworks must be translated into digital processes. Only once process flows are standardized and digitalized across company boundaries can mass processes become established.
4. Business models mature from large customers to households. New models often start with industrial customers because the business case holds up early, given the volumes involved. The pressure to make the high complexity of large-customer business manageable drives the further development of IT. Via the mid-market, processes become standardized and costs are lowered, until the model finally scales across the broad household customer base.
A look at market development since 1998 shows how these patterns emerged: three overlapping transformation phases can be identified (see Figure 2), which are sketched chronologically below — from early bundled-customer models to today’s “emerging” models such as energy sharing or V2G, which mark the third, currently still open phase in the chart.
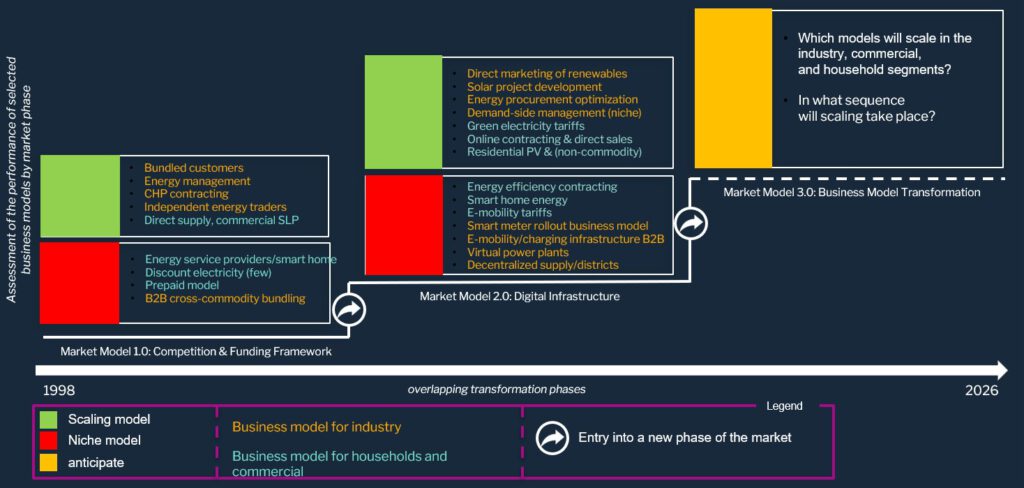
Liberalization from 1998 onward created new scope for action — supplier switching was theoretically possible, but in practice the process framework was missing. Which business models scaled? A brief overview:
In the B2B segment, bundled-customer models were on everyone’s lips at the start of market liberalization; aggregating consumption volumes was a popular instrument for winning new customers. Once the bundled-customer structure could be mapped and billed in IT systems, this established itself as one of the first successful innovative business models. At a time when data exchange processes were not yet reliable, large customers in particular were fiercely contested — their high switching costs could be offset by their volume. It was fertile ground for proving oneself in competition. Independent energy brokers brought additional competition to the wholesale market; the race for trading competence was on — IT became the decisive enabler.
After the introduction of standard load profiles and data exchange processes (GPKE) after 2005, direct supply to commercial and later household customers began to scale. With increasing digitalization of process flows, online contracting and direct sales became established as independent channels — discount electricity scaled after initial teething problems. Favored by the clear funding framework of the EEG (Renewable Energy Sources Act), green electricity tariffs were recognized as a differentiator against pure price competition.
With the introduction of the market premium model, a new B2B business field emerged: direct marketing of renewable energy developed step by step into a mass business with specialized service providers. Project development for large solar installations reached the next stage of professionalization.
In the B2C segment, the non-commodity business grew step by step — driven by the realization that self-generation is profitable. New digital capabilities for the sale and delivery of hardware — PV systems, storage, wallboxes — were added to classic electricity supply. The evolution of the energy supplier into a systems provider continued.
Competition sorted the field: those who invested early in capabilities and scaling were able to benefit. Those who approached the build-up of the necessary competencies too hesitantly, or who failed to reach critical mass, are withdrawing from this segment today.
What failed to scale? Smart home energy, demand-side management, and virtual power plants remained niche models. The common denominator: the lack of smart metering technology as a digital foundation — without it, time-variable products cannot be handled economically. Many pioneers had to learn that, without functioning framework conditions, building scalable business models is barely viable economically — regardless of the quality of the idea and the will to implement it.
The timing of market entry is at least as decisive as the quality of the product itself. Many models that scale today failed to work in an earlier phase — not because the idea was wrong, but because the infrastructure or digitalization was missing, or because customer demand was not yet mature.
Currently, many products are once again in the pipeline — dynamic tariffs, energy sharing, V2G — waiting for the right timing. Others are taking a fresh run at it. The decisive question is less whether the models work, and more when the framework conditions for scaling will be ready.
The regulatory framework for new business models
In 2023 and 2024, five regulatory building blocks were passed that, in combination, fundamentally change the market design: the Act on the Digitalization of the Energy Transition drives forward the rollout of smart metering systems as the data foundation; Section 14a EnWG (Energy Industry Act) integrates controllable consumption devices as active grid components; Section 41a EnWG makes dynamic tariffs mandatory; Section 42b EnWG lowers the hurdles to communal building supply compared with classic “tenant electricity” schemes; and Section 42c EnWG creates the framework for energy sharing within the distribution grid.
Viewed individually, each of these steps is incremental. In combination, they form a framework that not only enables new business models but also puts the classic commodity business under further structural pressure — accelerating the shift from full supply to residual supply.
Three developments reinforce this effect further: (1) communal building supply, energy sharing, and the smart-meter rollout enlarge the addressable target group. (2) For industrial customers, ESG pressure and economic viability increase the attractiveness of investments in renewable energy. (3) Flexibility is gaining importance — it could become the most effective lever for reducing system costs, but this requires products that give customers the right incentives to actively adjust their consumption.
The regulatory cornerstones are set — expanding the product range, billing processes, and IT capabilities is the logical consequence. Whoever evaluates these impulses individually underestimates their combined effect. Implementation will not happen overnight; it requires a structured plan for step-by-step development within the company.
The trend barometer for product innovation in the energy market
Building the necessary capabilities in a structured way requires a roadmap — one that takes the current IT landscape and existing competencies as a starting point and connects them with a clear view of market development. The goal is to sketch a path that fits the company and optimally supports the transformation into a flexibility provider.
As a supporting tool, we have developed a trend barometer intended to serve as a guide for discussion. Which products have scaling potential? When will the market be ready for them? Which products are implementable within the company — strategically and technically? And which capabilities are we missing in the short, medium, and long term?
Answering these questions creates a shared understanding within the company — and that is precisely the prerequisite for a business and IT roadmap that doesn’t just work on paper, but can also be successfully implemented.
In the trend barometer, we defined five product categories and assigned them a total of 25 product building blocks. A product building block describes the smallest self-contained unit of a product — it can constitute a product on its own, or be combined with other building blocks to develop more differentiated offerings.
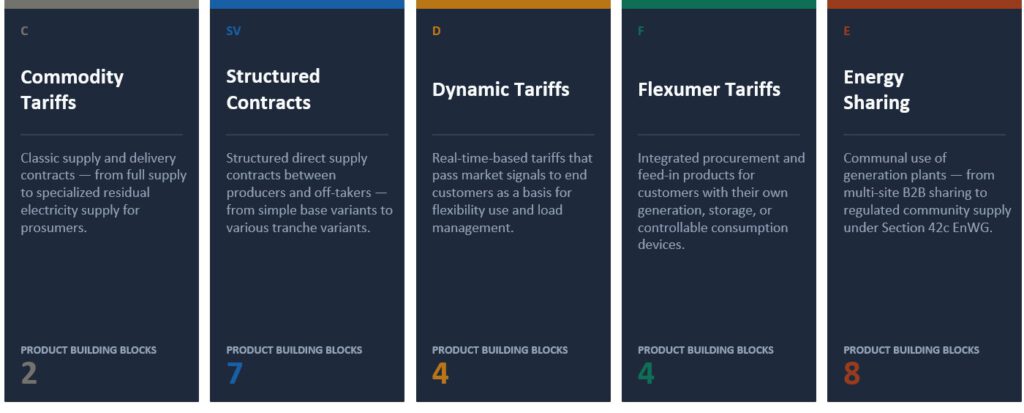
The five product categories cover the entire spectrum of the new energy market design. Commodity Tariffs form the familiar base with full and residual electricity supply. Structured Contracts comprise seven building blocks that map structured direct supply contracts between producers and off-takers in various forms — from forward transactions to complex PPA (Power Purchase Agreement) structures. Dynamic Tariffs bundle four building blocks for real-time-based tariffs that pass market signals directly to end customers. Flexumer Tariffs address, with four building blocks, customers with their own generation, storage, or controllable consumption devices, combining procurement and feed-in in one integrated product. Energy Sharing rounds off the overview with eight building blocks — from multi-site B2B sharing to regulated communal supply under Section 42c EnWG.
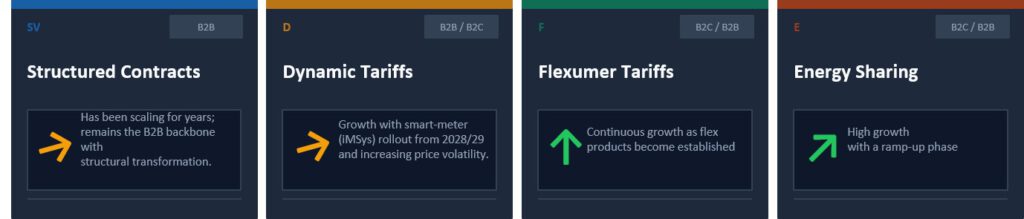
The trend barometer shows four product categories with different growth profiles and time horizons — Commodity Tariffs, as the familiar supply base, were already classified in Figure 1. The individual product building blocks show varying potential: within each category, there are building blocks that already carry scaling potential today, while others still need time.
The assessment by category:
Structured products will remain the backbone of B2B energy supply — at a high level, though with structural change: simple pay-as-produced tranches are losing relevance, while structured variants with price hedging are gaining ground. The market is maturing, and complexity is becoming the differentiator: whoever can offer tailor-made PPA structures secures a strong position in the B2B segment.
Dynamic tariffs are at the beginning of their development — moving from mandatory regulatory introduction toward local real-time tariffs. Today, only 5.5% of all metering points have a smart meter (BNetzA, 2025). By 2032, the installed base will grow significantly: from mandatory installation cases above 6,000 kWh alone, plus Section 14a consumption devices (wallboxes, heat pumps) and PV systems, a target figure of 25–30 million metering points emerges — around 50% of the total stock. With growing smart-meter penetration — realistically from 2028/29 — and rising price volatility, significant growth in dynamic tariffs is expected. The ability to manage dynamic tariffs is thus becoming a core competency on which many further products in the other categories will build.
Flexumer tariffs will grow strongly as home energy management systems (HEMS) become established, as the EEG feed-in tariff for existing installations is gradually phased out, and amid rising price volatility and growing e-mobility at scale. Flexumer tariffs are not only a growth field in their own right — their principles will flow into other product categories as a foundation and shape product logic there as well.
Energy sharing offers the greatest growth potential in the long term. The reason lies in its unique combination of value propositions: energy sharing combines cost reduction for consumers with — once the market matures sufficiently — significantly higher remuneration for feed-in compared to the exchange price, strengthens regional customer loyalty, and thereby opens up a continuously growing target group. It presents itself as an answer for plant operators whose older installations are coming out of subsidy support, and for new installations that, from 2027 onward, are expected to no longer receive fixed EEG remuneration. The evolution will proceed step by step: from simple SLP communities, via multi-site B2B solutions, to complex communal supply communities under Section 42c EnWG.
The trend barometer is based on 25 product building blocks, each with its own implementation prerequisites, timing, and dependencies. Anyone who wants to sharpen their own picture of market development and connect it to their individual company situation is invited to reach out to us for an exchange.
Shaping your own path to becoming a flexibility provider
No energy supplier will go through the same transformation as another. Starting positions, system landscapes, customer bases, capabilities, and strategic priorities are too different. What unites them all: the speed and direction of the transformation depend significantly on how well a company can manage flexibility — on the procurement side, in balancing group management, and in billing.
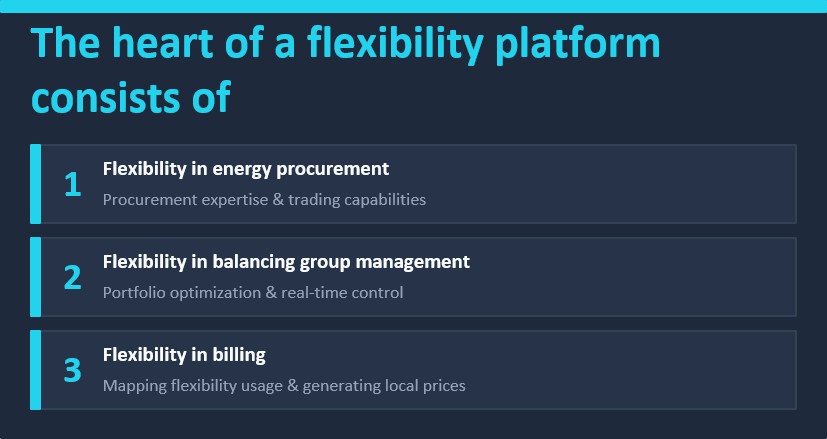
The central question is not whether, but how a utility can most efficiently develop its existing system landscape into a flexibility platform. The heart of such a platform consists of three areas that must work together: flexible energy procurement that efficiently processes market price signals; flexible balancing group management that integrates decentralized generation and controllable loads in real time; and flexible billing that can economically handle dynamic and complex products — including the generation of local price signals that actively invite customers to make their consumption more flexible. If any one of these three areas is missing, the core of the platform remains incomplete — and the product portfolio correspondingly limited in competition.
Building these capabilities does not have to be a parallel project alongside ongoing IT transformation. On the contrary: the smartest strategy is to integrate the step-by-step development of the flexibility platform into existing projects and initiatives. This saves time and money, creates synergies — and brings new revenue potential to fruition sooner.
The transformation into a flexibility provider is complex, but it can be approached in a structured way. Anyone who wants to develop a roadmap that fits their own system landscape and business strategy is invited to take the next step together with us.
Dr. Liliane Ableitner | Co-Founder & CEO | exnaton — liliane@exnaton.com
Klaus Lohnert | Chief Strategist | freEnergy Consulting GmbH — klaus@fre.energy